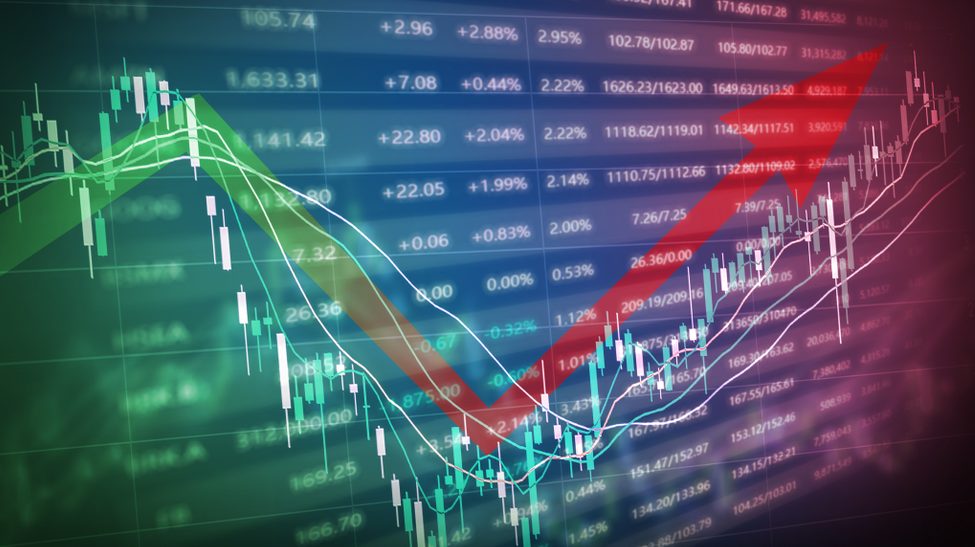
We have created a Candlestick Graph of the yearly stock prices from 2000 forward to allow users the opportunity to gauge overall stock health and emotional market swings
We show some of our work here to allow you to understand the limits we placed for the machine learning.
You can find our Final Analysis at the bottom of the Data Page. Here we describe the learning factors from this project as well as outline difficulties and limitations of our models.
.